Cubed: an introduction#
Tom White, August 2025
Idea#
Use Zarr as the underlying intermediate persistent storage between array operations.

Tasks operate on Zarr chunks.
Tasks are embarrassingly parallel, and their runtime memory can be tightly controlled.
Demo#
Cubed implements the Python Array API standard
import cubed.array_api as xp
a = xp.asarray([[1, 2, 3], [4, 5, 6], [7, 8, 9]], chunks=(2, 2))
Notice that we specify chunks, just like in Dask Array.
b = xp.asarray([[1, 1, 1], [1, 1, 1], [1, 1, 1]], chunks=(2, 2))
c = xp.add(a, b)
Cubed uses lazy evaluation, so nothing has been computed yet.
c.compute()
array([[ 2,  3,  4],
       [ 5,  6,  7],
       [ 8,  9, 10]])
Primitives#
Blockwise: applies a function to multiple blocks from multiple inputs
Rechunk: changes chunking, without changing shape/dtype
Dask introduced both of these operations.
Almost all array operations can be implemented using these two primitives!
Design#
Cubed is composed of five layers: from the storage layer at the bottom, to the Array API layer at the top:

Core and Primitive Operations#

Example: map_selection#

Each block in the output array is read directly from one or more blocks from the input.
Can cross block boundaries.
Example: reduction#

Implemented using multiple rounds of a tree reduce operation followed by a final aggregation.
Computation plan#
Cubed creates a computation plan, which is a directed acyclic graph (DAG).
c = xp.add(a, b)
c.visualize()
---------------------------------------------------------------------------
ModuleNotFoundError                       Traceback (most recent call last)
Cell In[4], line 2
      1 c = xp.add(a, b)
----> 2 c.visualize()

File /opt/hostedtoolcache/Python/3.12.13/x64/lib/python3.12/site-packages/cubed/core/array.py:232, in CoreArray.visualize(self, filename, format, optimize_graph, optimize_function, show_hidden, engine)
    198 def visualize(
    199     self,
    200     filename="cubed",
   (...)    205     engine: Literal["cytoscape", "graphviz"] | None = None,
    206 ):
    207     """Produce a visualization of the computation graph for this array.
    208
    209     Parameters
   (...)    230         in a notebook), otherwise None.
    231     """
--> 232     return visualize(
    233         self,
    234         filename=filename,
    235         format=format,
    236         optimize_graph=optimize_graph,
    237         optimize_function=optimize_function,
    238         show_hidden=show_hidden,
    239         engine=engine,
    240     )

File /opt/hostedtoolcache/Python/3.12.13/x64/lib/python3.12/site-packages/cubed/core/array.py:371, in visualize(filename, format, optimize_graph, optimize_function, show_hidden, engine, *arrays)
    339 """Produce a visualization of the computation graph for multiple arrays.
    340
    341 Parameters
   (...)    364     in a notebook), otherwise None.
    365 """
    366 finalized_plan = plan(
    367     *arrays,
    368     optimize_graph=optimize_graph,
    369     optimize_function=optimize_function,
    370 )
--> 371 return finalized_plan.visualize(
    372     filename=filename,
    373     format=format,
    374     show_hidden=show_hidden,
    375     engine=engine,
    376 )

File /opt/hostedtoolcache/Python/3.12.13/x64/lib/python3.12/site-packages/cubed/core/plan.py:616, in FinalizedPlan.visualize(self, filename, format, rankdir, show_hidden, engine)
    608 def visualize(
    609     self,
    610     filename="cubed",
   (...)    614     engine: Literal["cytoscape", "graphviz"] | None = None,
    615 ):
--> 616     from cubed.diagnostics.colors import APRICOT, LAVENDER, RED
    618     if engine == "cytoscape":
    619         return self.visualize_cytoscape(
    620             filename,
    621             format=format,
    622             rankdir=rankdir,
    623             show_hidden=show_hidden,
    624         )

File /opt/hostedtoolcache/Python/3.12.13/x64/lib/python3.12/site-packages/cubed/diagnostics/__init__.py:1
----> 1 from .rich import RichProgressBar as ProgressBar
      3 __all__ = ["ProgressBar"]

File /opt/hostedtoolcache/Python/3.12.13/x64/lib/python3.12/site-packages/cubed/diagnostics/rich.py:6
      3 import time
      4 from contextlib import contextmanager
----> 6 from rich.console import RenderableType
      7 from rich.progress import (
      8     BarColumn,
      9     MofNCompleteColumn,
   (...)     15     TimeElapsedColumn,
     16 )
     17 from rich.text import Text

ModuleNotFoundError: No module named 'rich'
Unlike a Dask graph which is at the task level, a Cubed graph is at the Zarr array level.
Optimization#
Cubed will automatically optimize the graph before computing it. For example by fusing blockwise (map) operations:


Optimization: an advanced example#
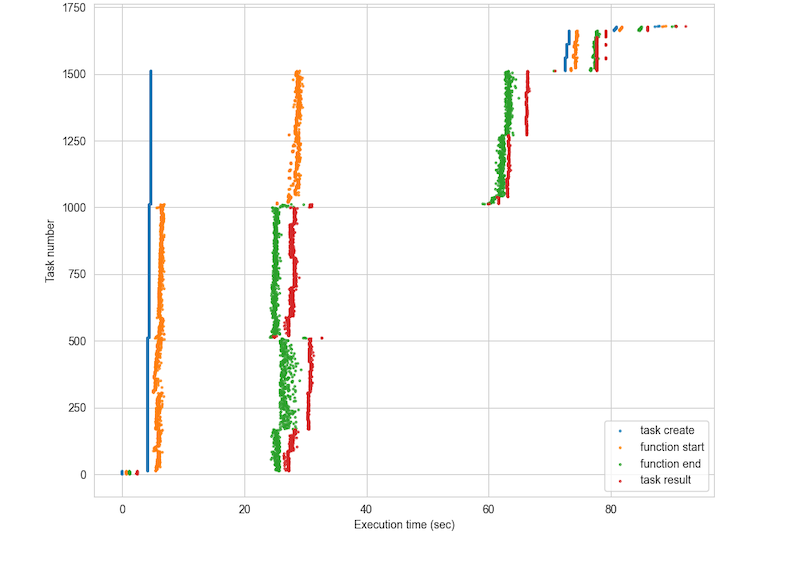
In early 2024 we implemented more optimizations to give a 4.8x performance improvement on the “Quadratic Means” climate workload running on Lithops with AWS Lambda, with a 1.5 TB workload completing in around 100 seconds

More details in Optimizing Cubed
Quadratic Means timeline#
Memory#
Cubed models the memory used by every operation, and calculates the projected_mem for a task - an upper bound.

If projected memory is more than what user specifies is allowed then an exception is raised during planning
import cubed
spec = cubed.Spec(work_dir="tmp", allowed_mem=100)  # not enough memory!
a = xp.asarray([[1, 2, 3], [4, 5, 6], [7, 8, 9]], chunks=(2, 2), spec=spec)
b = xp.asarray([[1, 1, 1], [1, 1, 1], [1, 1, 1]], chunks=(2, 2), spec=spec)
try:
    c = xp.add(a, b)
except ValueError as e:
    print(e)
Projected blockwise memory (192) exceeds allowed_mem (100), including reserved_mem (0)
Peak memory#
Cubed measures the peak amount of memory actually used during runtime.
Used to checked utilization, and improve the modelling.
  array_name    op_name  num_tasks  peak_mem_delta_mb_max  projected_mem_mb  utilization
0  array-003    rechunk          1             103.727104         0.000064          NaN
1  array-004  blockwise          4             654.286848       800.000008     0.817859
2  array-007    rechunk          1             103.645184         0.000064          NaN
3  array-008  blockwise          4             654.364672       800.000008     0.817956
4  array-009  blockwise          4             796.954624      1200.000000     0.664129
Runtimes#
Local machine
Start here to process hundreds of GB on your laptop using all available cores
Serverless
Lithops: multi-cloud serverless computing framework
Slightly more work to get started since you have to build a runtime environment first
Tested on AWS Lambda and Google Cloud Functions with ~1000 workers
Modal: a commercial serverless platform
Very easy to set up since it builds the runtime automatically
Tested with ~300 workers
Coiled Functions
Cluster/HPC
Ray
Apache Beam (Google Cloud Dataflow)
Globus Compute
Apache Spark
Scalability and robustness#
Serverless scales out
AWS Lambda supports 1000 concurrent instances by default
PyWren paper: https://shivaram.org/publications/pywren-socc17.pdf
Retries
Each task is tried three times before failing
Stragglers
A backup task will be launched if a task is taking significantly longer than average
Xarray integration#
Xarray can use Cubed as its computation engine instead of Dask
Just install the cubed-xarray integration package
Cubed can use Flox for
groupbyoperationsExamples at https://flox.readthedocs.io/en/latest/user-stories/climatology-hourly-cubed.html
Try out Cubed!#
Try it out on your use case
Get started at https://cubed-dev.github.io/cubed/
Some examples from the Pangeo community:
https://github.com/pangeo-data/distributed-array-examples