Diagnostics#
Cubed provides a variety of tools to understand a computation before running it, to monitor its progress while running, and to view performance statistics after it has completed.
To use these features ensure that the optional dependencies for diagnostics have been installed:
pip install "cubed[diagnostics]"
Visualize the computation plan#
Before running a computation, Cubed will create an internal plan that it uses to compute the output arrays.
The plan is a directed acyclic graph (DAG), and it can be useful to visualize it to see the number of steps involved in your computation, the number of tasks in each step (and overall), and the amount of intermediate data written out.
The Array.visualize() method on an array creates an image of the DAG. By default it is saved in a file called cubed.svg in the current working directory, but the filename and format can be changed if needed. If running in a Jupyter notebook the image will be rendered in the notebook.
If you are computing multiple arrays at once, then there is a visualize function that takes multiple array arguments.
This example shows a tiny computation and the resulting plan:
import cubed.array_api as xp
import cubed.random

a = xp.asarray([[1, 2, 3], [4, 5, 6], [7, 8, 9]], chunks=(2, 2))
b = xp.asarray([[1, 2, 3], [4, 5, 6], [7, 8, 9]], chunks=(2, 2))
c = xp.add(a, b)

c.visualize()
There are two type of nodes in the plan. Boxes with rounded corners are operations, while boxes with square corners are arrays.
In this case there are three operations (labelled op-001, op-002, and op-003), which produce the three arrays a, b, and c. (There is always an additional operation called create-arrays, shown on the right, which Cubed creates automatically.)
Array c is coloured orange, which means it is materialized as a Zarr array. Arrays a and b do not need to be materialized as Zarr arrays since they are small constant arrays that are passed to the workers running the tasks.
Similarly, the operation that produces c is shown in a lilac colour to signify that it runs tasks to produce the output. Operations op-001 and op-002 don’t run any tasks since a and b are just small constant arrays.
Callbacks#
Callbacks are objects that are registered to receive callback events on the client running the Cubed calculation.
You can pass callbacks to compute(), or functions that call compute, such as store or to_zarr.
Callbacks can also be used as Python context managers.
Progress bar#
You can display a progress bar to track your computation by passing callbacks to compute():
>>> from cubed.diagnostics import ProgressBar
>>> with ProgressBar():
...     c.compute()  # c is the array from above
...
  create-arrays 1/1 ━━━━━━━━━━━━━━━━━━━━━━━━━━━━━━━━━━━━━━━━━━━━━ 100.0% 0:00:00
  op-003 add    4/4 ━━━━━━━━━━━━━━━━━━━━━━━━━━━━━━━━━━━━━━━━━━━━━ 100.0% 0:00:00
The two current progress bar choice are:
from cubed.diagnostics import ProgressBaran alias forfrom cubed.diagnostics.rich import RichProgressBarfrom cubed.diagnostics.tqdm import TqdmProgressBar
This will work in Jupyter notebooks, and for all executors.
Timeline#
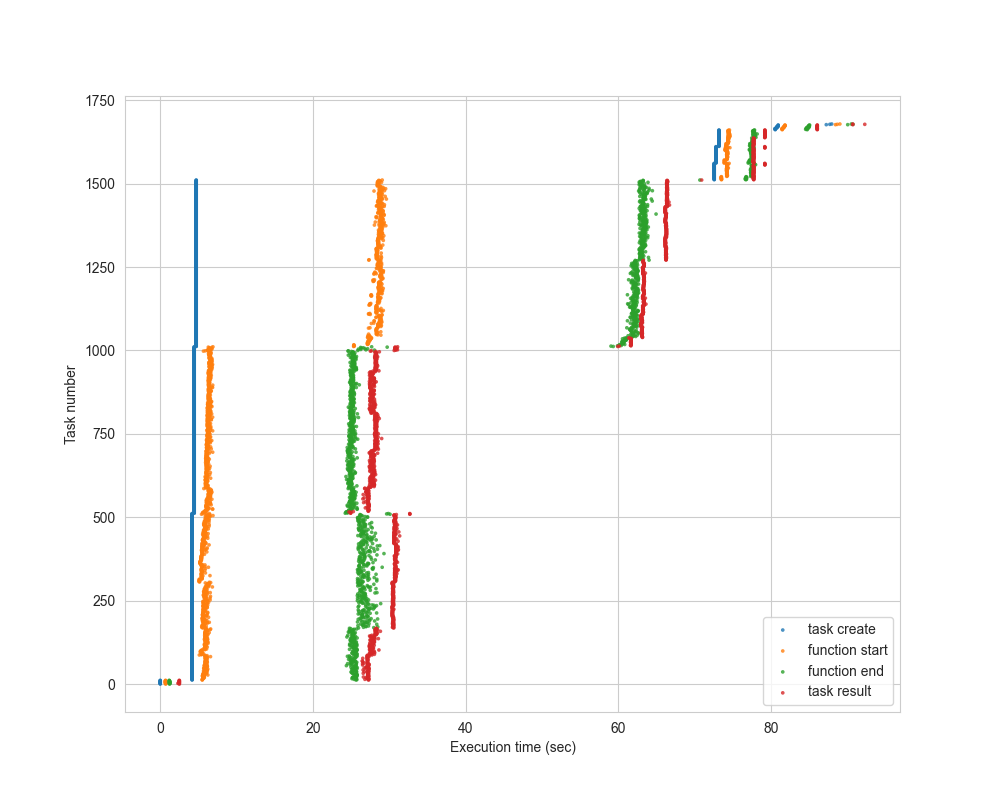
The timeline visualization is useful to determine how much time was spent in worker startup, as well as how much stragglers affected the overall time of the computation.
The timeline callback will write a graphic timeline.svg to a directory with the schema history/compute-{id}.
>>> from cubed.diagnostics.timeline import TimelineVisualizationCallback
>>> with TimelineVisualizationCallback():
...     c.compute()
...
The following example, which shows a “Quadratic Means” calculation on 1.5TB of data using Lithops (AWS Lambda), shows that we get very good horizontal scaling, since the orange dots are almost vertically aligned:

Memory usage#
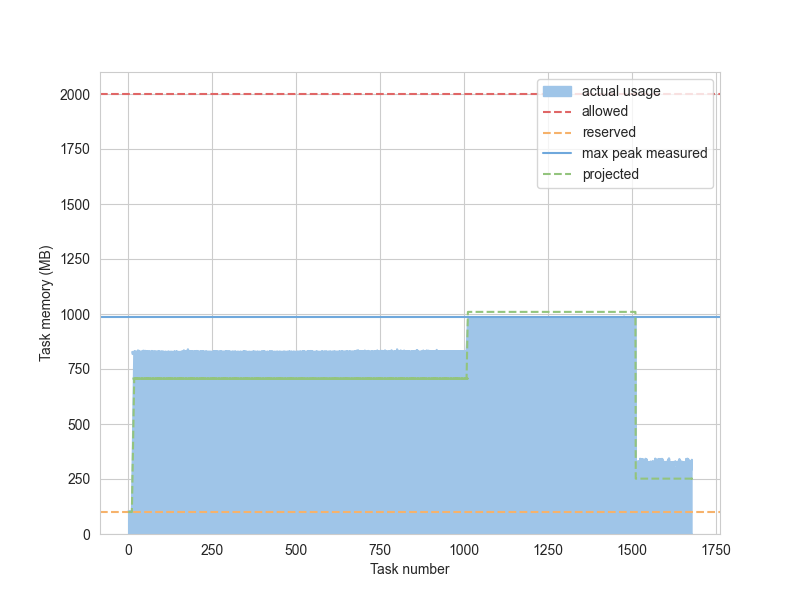
The memory usage visualization shows the maximum memory usage for each task, compared to the projected and allowed memory. (See for terminology.)
The memory usage callback will write a graphic memory.svg to a directory with the schema history/compute-{id}.
>>> from cubed.diagnostics.mem_usage import MemoryVisualizationCallback
>>> with MemoryVisualizationCallback():
...     c.compute()
...
The following example is for the same “Quadratic Means” calculation described above:

History#
The history callback can be used to understand how long tasks took to run, and how much memory they used. The history callback will write [events.csv, plan.csv and stats.csv] to a new directory under the current directory with the schema history/compute-{id}.
>>> from cubed.diagnostics.history import HistoryCallback
>>> with HistoryCallback():
...     c.compute()
...
Examples in use#
See the examples for more information about how to use the callbacks.
Memray#
Memray, a memory profiler for Python, can be used to track and view memory allocations when running a single task in a Cubed computation.
This is not usually needed when using Cubed, but for developers writing new operations, improving projected memory sizes, or for debugging a memory issue, it can be very useful to understand how memory is actually allocated in Cubed.
To enable Memray memory profiling in Cubed, simply install memray (pip install memray). Then use a local executor that runs tasks in separate processes, such as processes or lithops. When you run a computation, Cubed will enable Memray for the first task in each operation (so if an array has 100 chunks it will only produce one Memray trace).
Here is an example of a simple addition operation, with 200MB chunks. (It is adapted from test_mem_utilization.py in Cubed’s test suite.)
import cubed.array_api as xp
import cubed.random

a = cubed.random.random(
    (10000, 10000), chunks=(5000, 5000), spec=spec
)  # 200MB chunks
b = cubed.random.random(
    (10000, 10000), chunks=(5000, 5000), spec=spec
)  # 200MB chunks
c = xp.add(a, b)
c.compute(optimize_graph=False)
The optimizer is turned off so that generation of the random arrays is not fused with the add operation. This way we can see the memory allocations for that operation alone.
After the computation is complete there will be a collection of .bin files in the history/compute-{id}/memray directory - with one for each operation. To view them we convert them to HTML flame graphs as follows:
(cd $(ls -d history/compute-* | tail -1)/memray; for f in $(ls *.bin); do echo $f; python -m memray flamegraph --temporal -f -o $f.html $f; done)
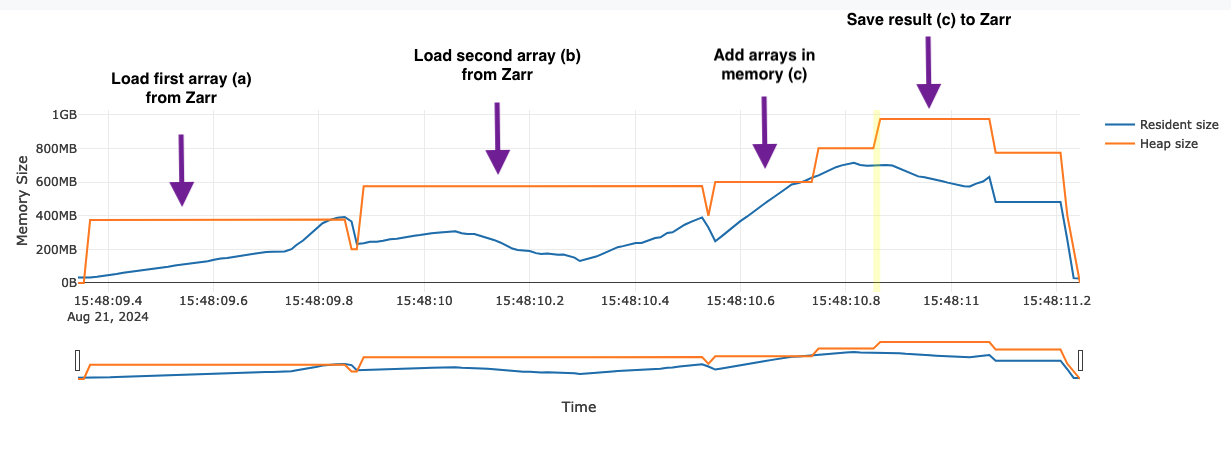
Here is the flame graph for the add operation:

Annotations have been added to explain what is going on in this example. Note that reading a chunk from Zarr requires twice the chunk memory (400MB) since there is a buffer for the compressed Zarr block (200MB), as well as the resulting array (200MB). After the first chunk has been loaded the memory dips back to 200MB since the compressed buffer is no longer retained.